In 1993, in “The Making of a Hinterland”, the historian Kenneth Pomeranz described how the government of China, in response to huge pressure from imperialist powers to open China to the global economy, emphasized the development of industrial manufacturing and trade zones (think Shanghai) and essentially left rural China to fend for itself. The positive actions were necessary and successful, but the neglect of the interior led to unrest. The Boxer and Communist rebellions – each intensely anti-central government and anti-foreign – both found it easy to recruit distressed and/or displaced peasants from rural China.
The United States has its own hinterland, one whose intensely-felt economic and cultural grievances are longstanding, and whose anger has also led to traces of armed rebellion in the past year. But the US hinterland gets to vote and yesterday, despite some alarming pre-election bluster, it took its revenge peacefully. No guns, no guillotine. Just lots of votes.
I’m not going to attempt a detailed analysis of this huge event – I’m still dealing with it and will be for some time. But I’ve been thinking about the “hinterland” phenomenon for some time – in fact since the in-some-ways-similar Bush election of 2000. In this post, I’m not going to address the cultural side of this issue at all (for a quick take, see Badger, Bui, and Pearce, NYT) Instead, I present some visuals to highlight the economic dimension of this still-intensifying phenomenon: the incredibly strong link between geography, education, income, and recent voting patterns.
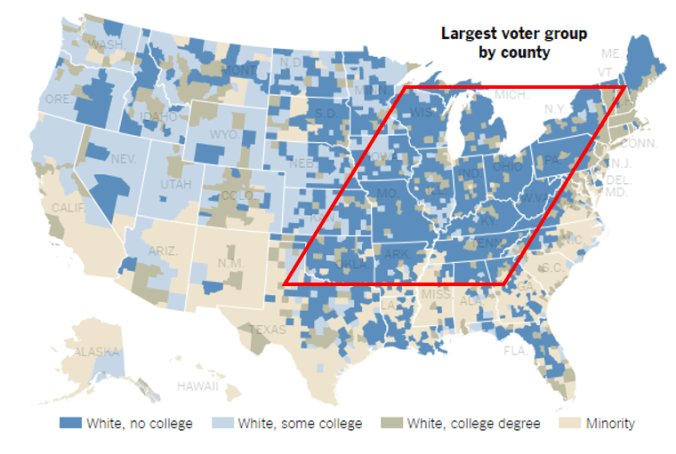
What is a hinterland? It’s easier to show than to say. The following graphic (Fig. 1) maps the USA by “largest voting group”. What I call the hinterland in this post is the parallelogram, filled with dark blue, whose corners are Oklahoma, Wisconsin, upstate New York, and eastern Tennessee. Less-educated whites are more concentrated in this area of the country than in any other.
Figure 1. US Voting Blocs by Educational Level (Fessenden, 2016)
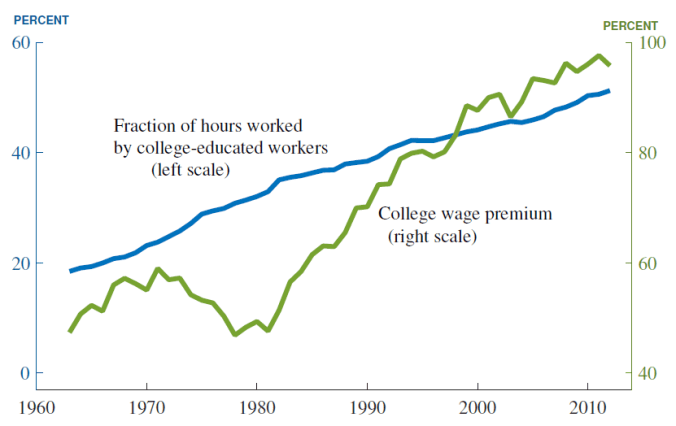
Why does this matter? It matters because education correlates hugely with income (Fig. 2) and because access to higher education, especially among males, topped out some time ago. (Fig. 3).
Figure 2. Relative Wages by Educational Level, 1963-2012 (Autor, 2014)
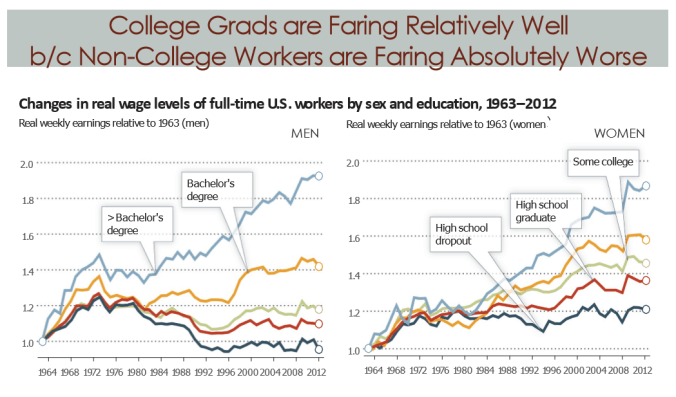
In Figure 2, David Autor of MIT lays out the degree to which less-educated workers are losing out to those with college degrees. High school dropouts earn less today in real terms than they did in 1963. In the meantime, the pool of winners who have the valuable college degree is growing more slowly than it used to. As Chad Jones shows in Figure 3, the percentage of hours worked by male college graduates grew more slowly from 1980 to 2010 than it did from 1960 to 1980, but the earnings share of college graduates, relative to unskilled workers, grew by 60%. It’s partly demographics and partly economics, but the opportunity represented by a college education is being extended to an only slowly growing segment of the workforce. Today’s losers have little reason to see themselves as tomorrow’s winners.
Figure 3. Hours worked vs relative income, college to non-college workers, 1963-2012 (Jones, 2015)
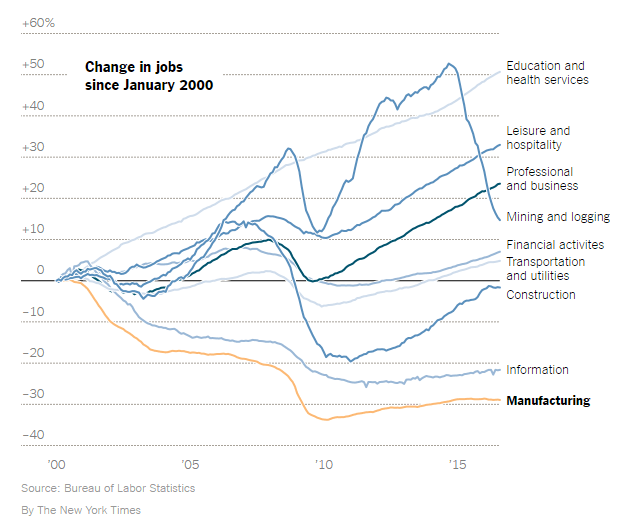
How has this happened? The stark explanation comes in the form of the decline in manufacturing jobs (Fig. 4) and related sectors (Fig. 5). The United States manufacturing sector has, in fact, been shrinking since World War II. But the abrupt decline since 2000, while NAFTA has often been blamed for it, represents what labor economist David Autor and others have called the “China Shock” – the completely unexpected consequence of China owning “Most Favored Nation” trade status and its abrupt switch to an opportunistic, largely capitalist economy in the 1990s.
Figure 4. Decline in US Manufacturing, 1960-2011 (Baily and Bosworth, 2014)

According to trade economists, workers ideally “adjust” to shocks doled out by changing trade patterns – by moving to jobs in different area or sectors. But affected American manufacturing workers have not “adjusted” well, and Figure 5, from Peter Goodman’s election port-mortem in the New York Times, shows why. Today, there are few places for displaced manufacturing worker to go. Construction has no more room for workers than it had in 2000, and the recent collapse of oil prices has sent the once-booming mining sector plunging toward no net change. (The collapse of oil prices in last two years may, in fact, have an important undocumented driver of the angry wave that led to Tuesday’s election result.)
It’s almost impossible to over-emphasize – although it has been very easy to miss – the level of desperation signified by these downward-trending curves. And why haven’t Information Technology workers, who numbers have also been declining since the ‘90s dotcom and related “Year 2000” booms, become equally desperate? Because IT workers do have career paths and attractive sector-switching options. Temporary IT workers, many of them immigrants, can go home and seed thriving IT sectors in their countries of origin. Senior IT workers can transition, as engineers always have, into what Figure 5 says is a rapidly growing “Professional and Business” sector. Skilled elites have options that unskilled wage workers do not.
Figure 5. Changes in Employment Levels by US Job Sector, 2000-2016 (Goodman, 2016)
So how did this economic picture play out in the election? We all know, but we might still learn from graphics that show how the regions in the country that voted Republican or Democratic by over 20% margins changed between 2000 (another close election with a Democratic plurality undone by the Midwest) and 2016 (Figures 6 and 7).
Figure 6. US counties voting Democratic or Republican by more than 20%, 2000. (New York Times)
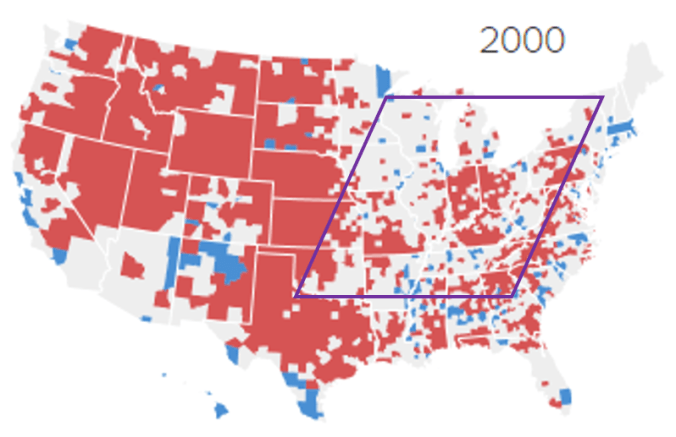
Figure 7. US counties voting Democratic or Republican by more than 20%, 2016. (New York Times)

As Figure 7 shows, the white, less-educated, under-earning, underemployed voting bloc defined by the “parallelogram” we discerned in Figure 1 has gone from almost neutral to solid red. The Democrats have completely lost touch with the industrial heartland.
There are ironies aplenty in the Democrats’ failure. In one sense, the Democratic campaign was based upon “bring us together”, “E Pluribus Unum” solidarity-promoting value sets – constitutionalism, multiculturalism, and respect for minority rights – that might have seemed to be a winning combination. But history tells us – and this is a bleak observation – that minority rights don’t count for much when a significant portion of the ethnic majority feels aggrieved and dispossessed. You can preach against this truth, as the Democrats did, but the congregation wasn’t listening. Just the opposite: the Rooseveltian gift that Democrats once had for building majority coalitions out of groups that despised each other seems to have been lost. The Midwest white working class turned out en masse for the candidate who “got it” and got them. For gobsmacked Democrats – and I am certainly one of them – I have only one bit of counsel: It’s not going to stop til we wise up.
—References—
Notes: Thanks to Dan McClure of ThoughtWorks for valuable critique. Figures 6 and 7 are from an online New York Times article, available on November 10, 2016 that appears to have been taken down. The parallelogram superimposed on Figures 1, 6, and 7 is my own conceit and not responsibility of the sources. The last sentence of the post, of course, is a riff of Aimee Mann’s song “Wise Up” from the Paul Thomas Anderson movie Magnolia.
Autor, David, “Skills, education, and the rise of earnings inequality among ‘the other 99 percent’’, Science, 344:6186, May 23, 2014, pp. 843-851.
Badger, Bui and Pearce, “The Great Divide: The Election Highlighted a Growing Urban-Rural Split”, The New York Times, November 11, 2016.
Baily and Bosworth, “US Manufacturing: Understanding Its Past and Its Potential Future”, Journal of Economic Perspectives, 28:1, Winter 2014, pp. 3-26.
Fessenden, Ford, “Donald Trump’s big Bet on Less-Educated Whites”, The New York Times, November 7, 2016.
Goodman, Peter, “Trump Rides a Wave of Fury That May Damage Global Prosperity”, The New York Times, November 9, 2016.
Jones, Charles, “The Facts of Economic Growth”, 2015, forthcoming in John Taylor and Harold Uhlig, Handbook of Macroeconomics, Vol. 2.
Pomeranz, Kenneth, The Making of a Hinterland: State, Society, and Economy in Inland North China, 1853-1937, University of California Press, 1993.
